In numbers: Europe’s mounting plastic waste problem unpacked

Alexia Barakou
With so much data circulating on plastic waste, it is difficult to unpack it all. Investigate Europe calculated some striking statistics from this sea of data to give an idea of what our plastic problem is all about.
“Plastic is not necessarily a monster,” says Helmut Maurer, a former official in the EU Commission’s circular economy directorate. Cheap, versatile and practical, it’s hard to imagine life without it. “But what is a monster,” he says, “is the way we make use of short-lived plastic. And this is what causes also the bad image and what causes the pollution.”
Packaging accounts for a significant proportion of plastic production (44 per cent globally, 40 per cent in the EU), and beyond that, the industry produces a lot of throwaway plastic.
“Plastic pollution is not a waste issue. It’s a production issue. It’s an overproduction issue,” says Delphine Lévi Alvarès from NGO Break Free from Plastic. Almost 10 billion tonnes of plastic have been made globally since the 1950s – two-thirds of that in the two decades after 2000.
This exponential growth is projected by the OECD to continue unless something changes. And this comes at a high environmental cost: by 2050, greenhouse gas emissions associated with plastic production, use and disposal could account for 15 per cent of allowed emissions.
According to Plastics Europe, one third of all plastics were produced in China in 2022. Europe’s share is declining, with 15 per cent produced on the continent last year.
Europe is above the world average in the proportion of recycled plastic, but even here it is still only around 10 per cent. Globally, the rate is much worse at six per cent.
While the amount of recycled plastic is increasing, the amount of virgin plastic is increasing even more. We are also a long way from the EU’s recycling targets, and even further from the circular economy dreams of the Green Deal. “The thing is that plastics will never be circular,” Maurer adds. “Plastics are petrochemical products, and it’s by nature easily degrading through oxidation. When you want to reuse plastic waste, you have to add additives, you have to add virgin material and you have to boost up the degraded material.”
Therese Karlsson, a researcher at the International Pollutants Elimination Network, agrees: “We need to decrease how much plastics we’re using because the amounts that we are using today, there is no way of dealing with that in a sustainable way.” But instead, we’re leaving a bigger and bigger pile of waste behind. Sorted plastic waste production in the EU doubled from 9.5 million tonnes in 2004 to 19 million tonnes by 2020.
Therese Karlsson, a researcher at the International Pollutants Elimination Network, agrees: “We need to decrease how much plastics we’re using because the amounts that we are using today, there is no way of dealing with that in a sustainable way.” But instead, we’re leaving a bigger and bigger pile of waste behind. Sorted plastic waste production in the EU doubled from 9.5 million tonnes in 2004 to 19 million tonnes by 2020.
On average, an EU citizen produces 42.6kg of sorted plastic waste annually, a Belgian more than double that and the Italians are not far behind. However, this amount only represents the amount of plastic waste collected separately, and we could even praise the Belgians and Italians for their discipline in sorting, even though they produce a lot of plastic waste.
Household waste is produced on a much grander scale: it was 180 million tonnes in 2004 and 203 million tonnes in 2020. A significant proportion of this is also plastic, mainly packaging. Laboratory tests conducted by an incineration facility in Budapest found that about 15 per cent of mixed household waste is plastic. Figures can vary greatly across countries, but it is almost certain that such plastics are not recycled.
It is not surprising then that only 32.5 per cent of plastic at best is recycled in Europe. Multiple NGOs and studies have shown that much of the plastic sent for recycling ends up in landfills or is burned as data only captures plastics “sent or prepared for recycling”.
Recycling rates for plastic packaging waste are a hair better, but in most countries far below the EU’s 2025 and 2030 targets. Plastic packaging waste generated in the EU actually increased by three million tonnes from 2012 to 2021.
Although the amount of recycled plastic packaging waste per citizen increased by 3.2kg between 2010 and 2020, the amount generated was 20kg more per person, which is a further drop in the recycling rate.
In 2020, the average EU citizen generated nearly 35kg of plastic packaging waste. That is equivalent to 1070 bottles, based on the average weight of a 500ml PET bottle. Hungarians use the most plastic packaging per capita, while Croatians the least.
“We need to kill the illusion that these things are recycled. If you buy things in plastic and you think they’re going to be recycled when you throw them away, it’s a very different feeling than when you know they’re going to end up in a landfill or be incinerated,” argues Nusa Urbancic, campaigns director at Changing Markets.
The most optimistic estimate is that around 39 per cent of discarded plastic packaging is recycled. Another 39 per cent is incinerated and the rest is sent to landfills But some of the plastic waste is sent on its way.
Around 30 million tonnes of plastic waste is generated in the EU every year, and around three per cent of this is exported externally. It was more than double in the 2010s, when up to 10 per cent of Europe’s plastic waste was shipped around the world.
Investigate Europe
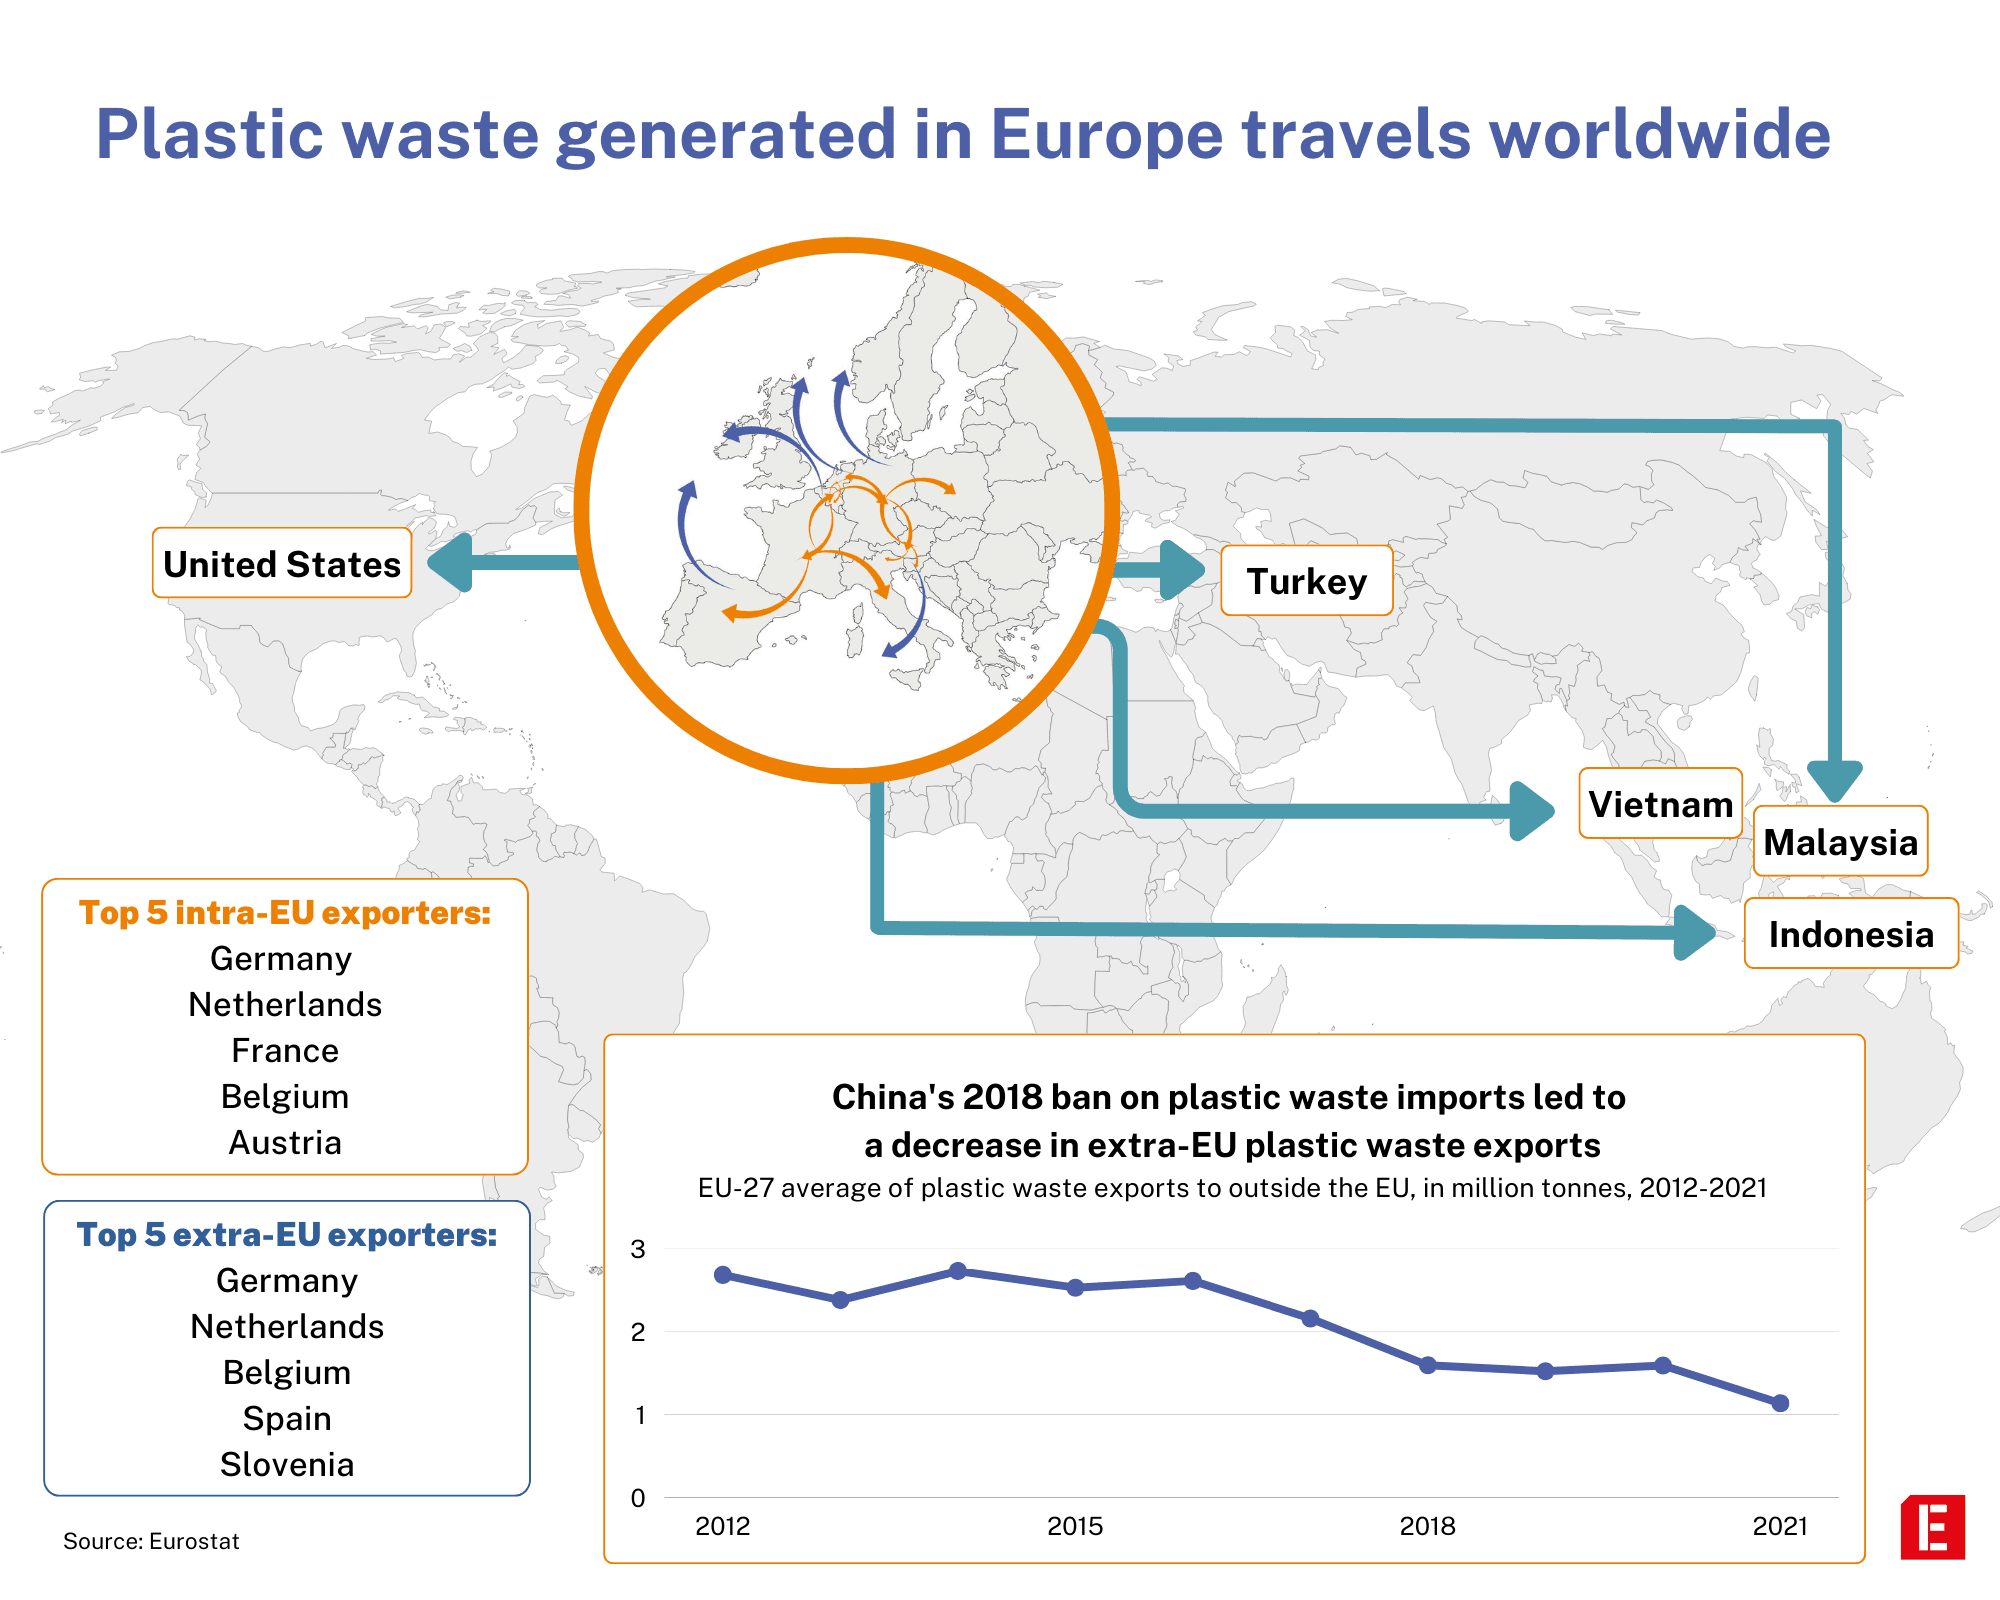
In 2012, the EU sent more than 1.5 million tonnes to China, but this dropped sharply after an import ban took effect in 2018. Only 705 tonnes arrived at Chinese ports in 2021.
Plastic waste has been diverted to new routes: some South East Asian countries are trying to fill the void left by China, and Turkey now accounts for nearly 40 per cent of EU plastic waste exports. But the vacuum left by China’s ban remains. This led to unwanted consequences: since 2018, the amount of plastic waste incinerated in Europe increased by 39 per cent.
Plastic waste has been diverted to new routes: some South East Asian countries are trying to fill the void left by China, and Turkey now accounts for nearly 40 per cent of EU plastic waste exports. But the vacuum left by China’s ban remains. This led to unwanted consequences: since 2018, the amount of plastic waste incinerated in Europe increased by 39 per cent.
At the same time, intra-EU waste flows picked up, but it is impossible to say by how much. Re-exports are not treated separately in the statistics, i.e. waste is included in the statistics as often as it is re-exported. According to several experts, the amount of plastic waste moving within the EU each year could be 10 per cent to 20 per cent lower, i.e. somewhere between 2 and 2.5 million tonnes.
And, as the EU’s intra-EU export/import statistics show, plastic waste flows mainly to Germany, the Netherlands and Belgium – countries with major ports. These countries also appear among the exporters outside the EU, so it is safe to assume that they are not (only) on the list because of their own plastic waste exports.
Graphics: Marta Portocarrero
Editor: Chris Matthews